
In this article
Some evenings the news reports that “the Dow fell” while “the S&P 500 rose”. It sounds contradictory, since both are meant to measure the American stock market. The explanation has nothing to do with the economy and everything to do with arithmetic: the two indexes decide how much each company counts in completely different ways.
Key facts
- 30 vs about 500: the Dow Jones Industrial Average tracks 30 large US companies; the S&P 500 tracks about 500.
- Price vs size: the Dow weights stocks by their share price; the S&P 500 weights them by their market value.
- About 5.9 points: roughly how much the Dow moves when any one of its stocks moves by $1 (2026 divisor).
- Stock splits change a company’s weight in the Dow but not in the S&P 500.
How the Dow is calculated
The Dow, first published in 1896, is a price-weighted index. It adds up the share prices of its 30 companies and divides the total by a number called the Dow divisor, which is adjusted after stock splits and company changes so the index does not jump for reasons unrelated to the market. The method is set out in S&P Dow Jones Indices’ index methodology.
Because only the price matters, a company with a $500 share price counts ten times as much as one with a $50 share price, even if the cheaper company is far bigger. In 2026 the divisor was about 0.168, which means a $1 move in any Dow stock moves the index by about 5.9 points.
How the S&P 500 is calculated
The S&P 500 is weighted by float-adjusted market capitalization: the share price multiplied by the number of shares available to ordinary investors. A company worth $3 trillion counts roughly ten times as much as one worth $300 billion, whatever its share price. Most major indexes in the world, including the Nasdaq-100 and the FTSE 100, use some version of this method.
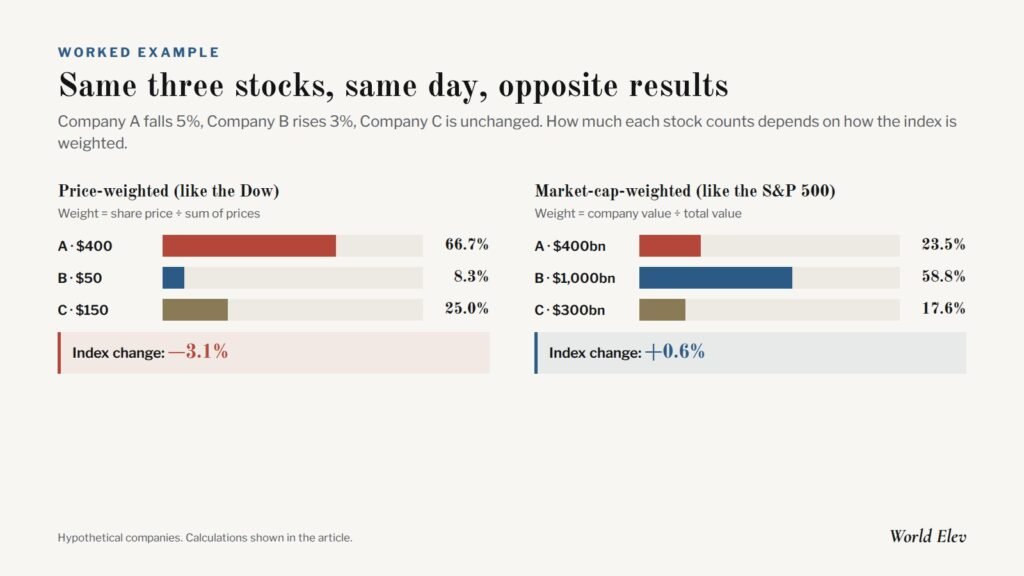
A worked example
Imagine a tiny market with three companies. Company A has a $400 share price and 1 billion shares, so it is worth $400 billion. Company B has a $50 share price but 20 billion shares, so it is worth $1 trillion. Company C trades at $150 with 2 billion shares, worth $300 billion.
| Company | Share price | Market value | Weight by price | Weight by value |
|---|---|---|---|---|
| A | $400 | $400bn | 66.7% | 23.5% |
| B | $50 | $1,000bn | 8.3% | 58.8% |
| C | $150 | $300bn | 25.0% | 17.6% |
Now suppose Company A falls 5 percent and Company B rises 3 percent, while C is unchanged.
- Price-weighted index: A loses $20 and B gains $1.50, a net change of minus $18.50 on a total of $600. The index falls about 3.1 percent.
- Market-cap-weighted index: A’s fall counts for 23.5 percent of 5 percent, a loss of 1.2 points; B’s rise counts for 58.8 percent of 3 percent, a gain of 1.8 points. The index rises about 0.6 percent.
Same companies, same day, opposite headlines. In the real market, this happens when a few high-priced Dow stocks have a bad day while the largest companies by value, which dominate the S&P 500, have a good one.
Real-world quirks of price weighting
The most expensive share is not the biggest company
Under price weighting, the stock with the highest share price has the largest weight. In recent years that has been Goldman Sachs, even though several other Dow members are worth far more. S&P Dow Jones Indices publishes the current members and weights.
Splits shrink a company’s influence
When a company splits its stock, say four new shares for each old one, the share price falls to a quarter while the company’s value stays the same. In the S&P 500, nothing changes. In the Dow, the company’s weight falls to about a quarter overnight. Apple’s 4-for-1 split in August 2020 cut its weight in the Dow sharply for exactly this reason.
Giant companies can barely move the Dow
Nvidia joined the Dow in November 2024, replacing Intel. Because Nvidia had split its stock 10-for-1 earlier that year, its share price was modest, so it entered the Dow with a small weight even though it was one of the most valuable companies in the world. In the S&P 500, by contrast, it ranks among the very largest weights.
| Dow Jones Industrial Average | S&P 500 | |
|---|---|---|
| Number of stocks | 30 | About 500 companies (slightly more share lines, as a few have two share classes) |
| Weighting | Share price | Float-adjusted market value |
| Effect of a stock split | Company’s weight falls | No change |
| Who picks the members | Committee at S&P Dow Jones Indices | Committee at S&P Dow Jones Indices |
| Best used for | A long historical record (since 1896) | A broad picture of large US companies |
Which one should you watch?
For judging how the US stock market as a whole is doing, most professionals use the S&P 500, because it covers far more companies and weights them by their real economic size. That is also why most index funds track it. The Dow remains useful as a long historical series and a headline number, but its price weighting is widely regarded as a quirk of history rather than a modern design. The U.S. Securities and Exchange Commission’s investor education site explains the main types of index if you want to compare others.
Note: This article explains how indexes are built. It is not investment advice.
Frequently asked questions
Why does the Dow still use price weighting?
Mainly for continuity. The Dow began in 1896, when adding up a few share prices by hand was the practical way to build an average, and changing the method would break its long historical record.
Is a 500-point fall in the Dow a big deal?
It depends on the level. With the Dow in the tens of thousands, 500 points is around one percent. Percentages are a better guide than points.
Can the Nasdaq move differently again?
Yes. The Nasdaq-100 is weighted by market value like the S&P 500, but it holds only non-financial companies listed on the Nasdaq exchange, so it leans more heavily towards technology.
To dig into the companies behind the indexes, read our guide to reading a company’s annual report, see what interest rate decisions mean for your household, or browse the Stocks section.